 Add us as a preferred source on Google
According to Statista, the ecommerce market is expected to cater to around 4,044,179,332.1 users by 2031. So having an online storefront puts you in a strong position. More importantly, understanding how the ecommerce ecosystem works will help you serve customers better and gain insights that support scalability. The modern ecommerce ecosystem relies on data.
From product views and abandoned cart rates to supply chain delays and seasonal spikes, everything leaves a digital footprint. However, this data is often scattered, creating inconsistencies and leaving untapped opportunities. This is where ecommerce business intelligence steps in. It gives businesses the tools they need to combine, evaluate, and leverage data to support timely, data-driven decisions.
Follow this guide to understand how ecommerce business intelligence turns your store data into profit. Learn how our ecommerce development services design and integrate solutions aligned with your business goals.
You will also get to know about ecommerce analytics tools for monitoring overall business performance.
What Is Ecommerce Business Intelligence?
Ecommerce business intelligence is the ability to gather, evaluate, and analyze large amounts of data. This helps to understand customer behavior patterns, investigate the causes of shopping cart abandonment, generate relevant product recommendations, and optimize marketing and sales channel performance. It turns data-driven insights into actionable ecommerce growth strategies that improve decision-making and support measurable business growth.
Ecommerce Business Intelligence vs Ecommerce Analytics vs Web Analytics
The core difference is that business intelligence combines past and current data from across the business to show what has happened and what is happening now, while ecommerce analytics digs into specific areas, such as orders and carts, to explain why something happened and predict what comes next. Web analytics focuses only on how visitors behave on your site.
To understand the key differences between ecommerce business intelligence vs ecommerce analytics vs. web analytics, refer to the table given below:
| Criteria | Ecommerce Business Intelligence | Ecommerce Analytics | Web Analytics |
| Major Focus | Prioritizes cross-functional enterprise data (finance, marketing, CRM, and inventory) | Focuses on store merchandising performance and conversion funnels | Emphasizes on-site behavior and traffic quality |
| Primary Questions | What’s happening across the whole business right now, and how to optimize it? | What’s the reason behind abandoned carts? And what’s likely to happen next | How visitors are interacting with the site |
| KPIs | Net profit margins, omnichannel inventory turnover, centralized customer lifetime value, ERP-synced cash flow | Conversion rate, average order value (AOV), customer acquisition cost (CAC), LTV, and SKU sales | Click-through rate (CTR), bounce rate, sessions, pageviews, time on page |
| Primary Tools | Tableau, Microsoft Power BI, Qlik | Shopify Analytics, Glew, specialized ecommerce apps | Google Analytics and Adobe Analytics |
| Scope of Data | Multi-source | Order data and storefront cart | User journey data and clickstream |
| Primary Audience | C-suite, data engineering teams, financial planners | Merchandisers, growth marketers, ecommerce specialists | Content managers, SEO specialists, UX/UI designers |
Why Business Intelligence in Ecommerce Matters in 2026
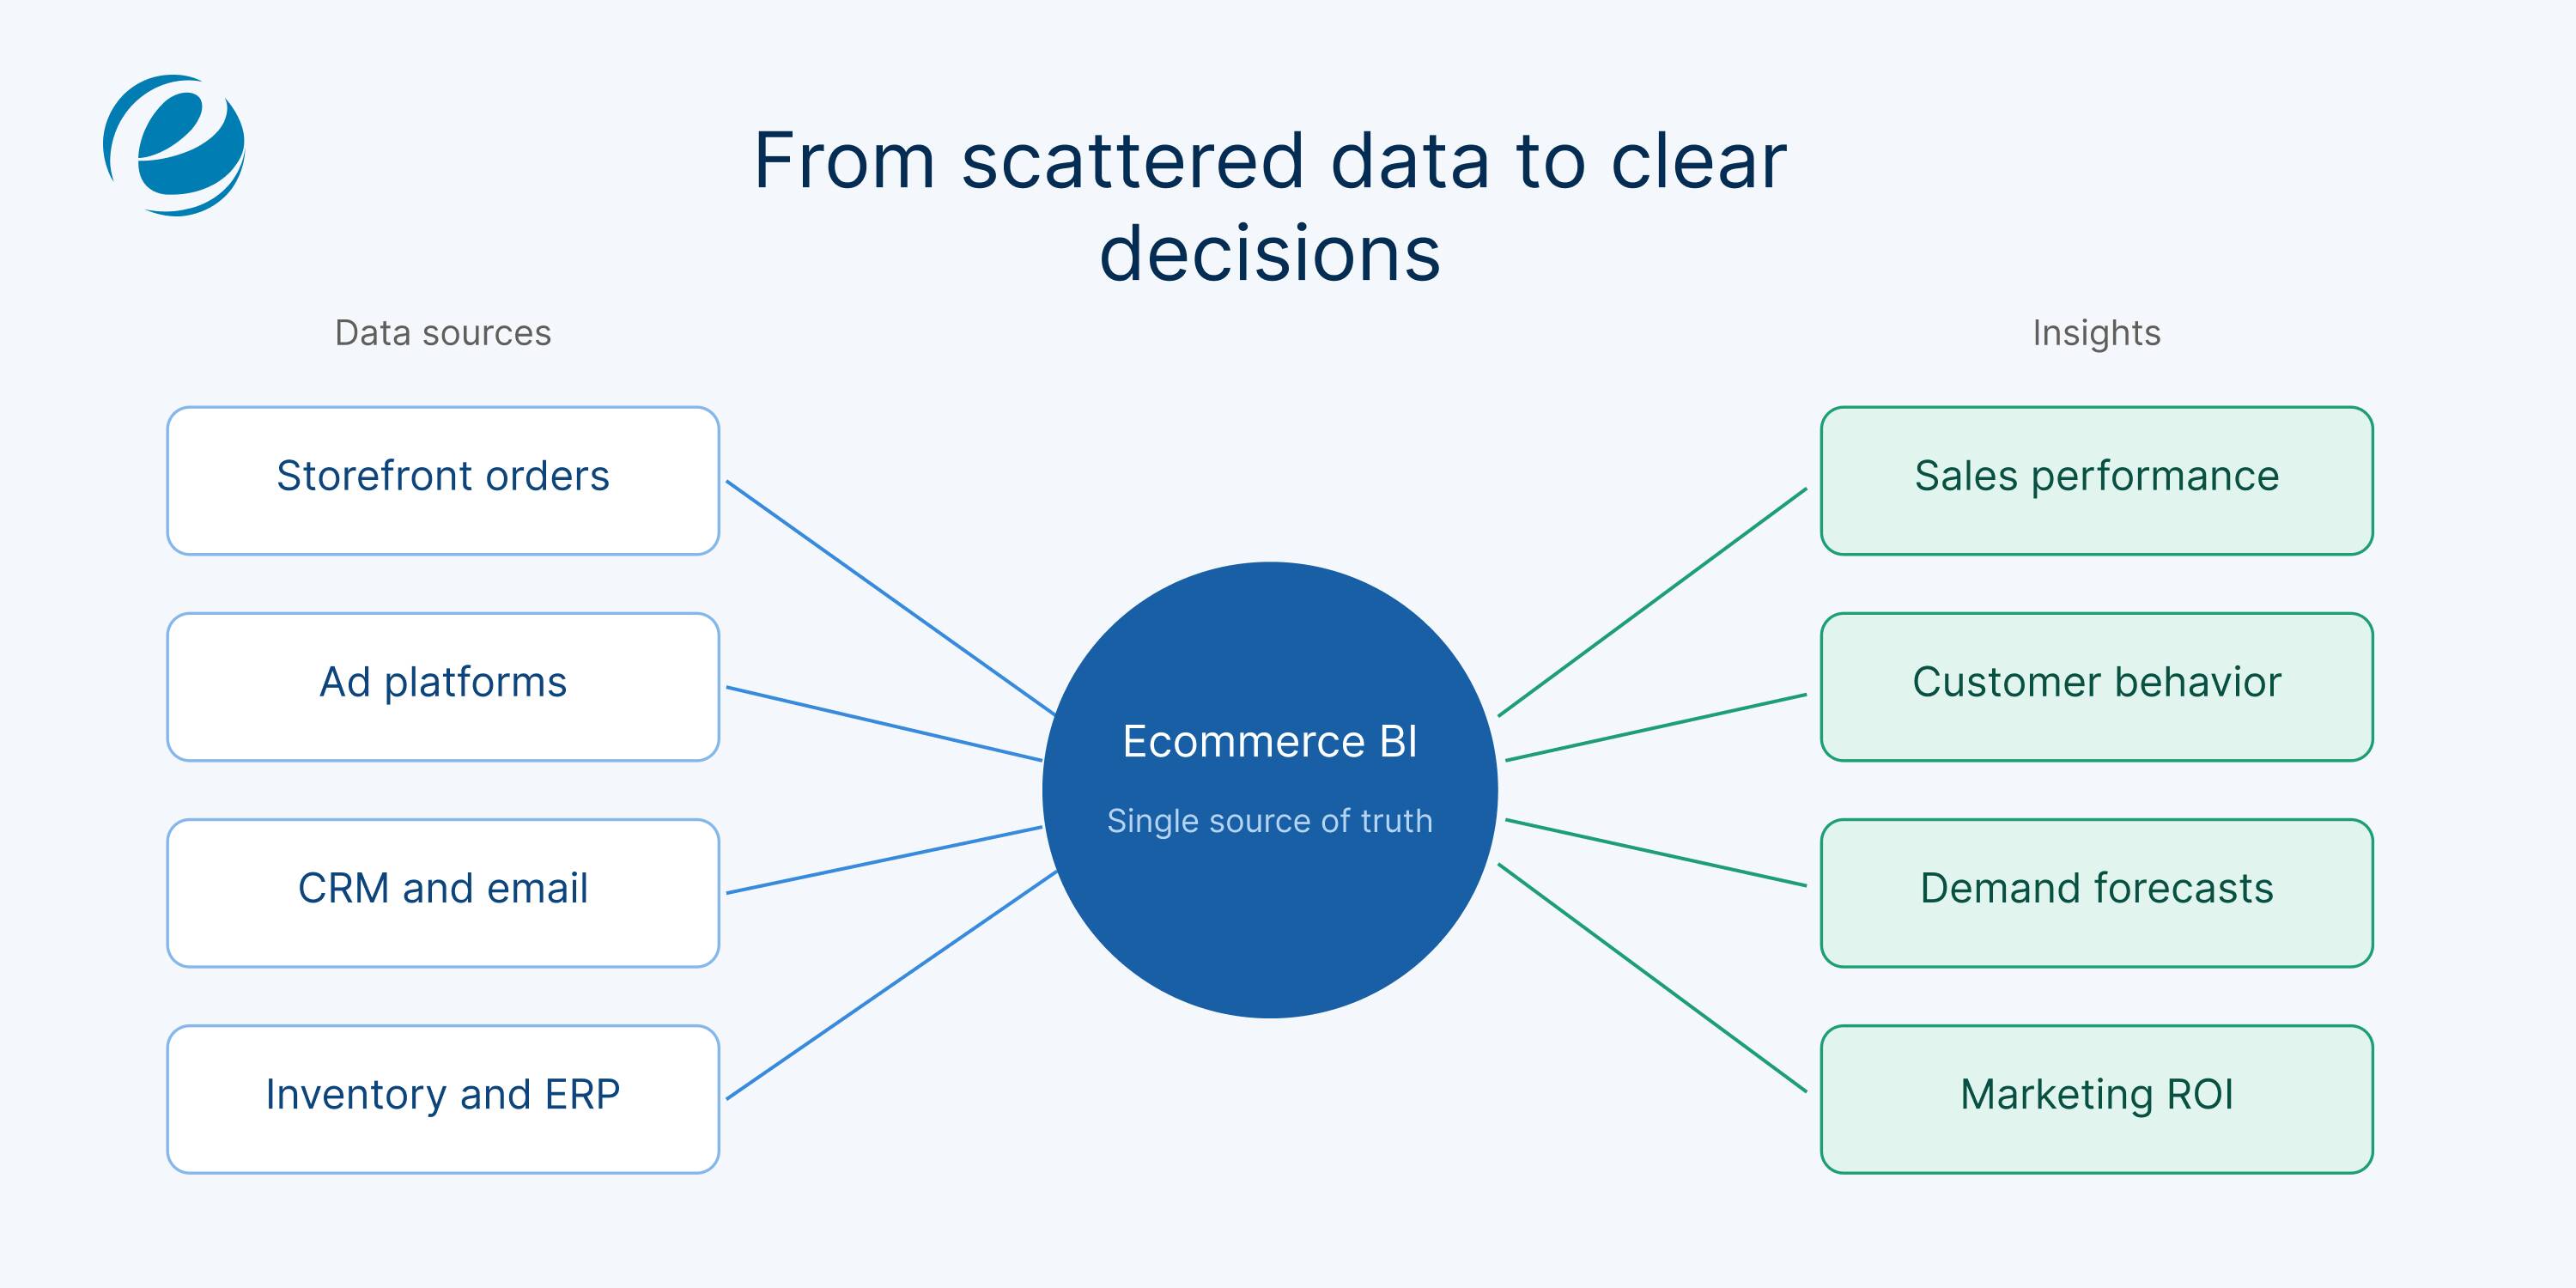
Business Intelligence for ecommerce matters in 2026 because the ecommerce competitive environment is brutal. Margins are lower, customer acquisition costs are higher, and customers have more options. In all such scenarios, the winning brand makes smart decisions quickly. Here is what business intelligence in ecommerce specifically enables:
-
Centralized Data, No Scope For Guesswork
Ecommerce brands use Shopify, WooCommerce, Google Ads, and many other platforms. Business intelligence for ecommerce brings it all into a single source of truth so your marketing, finance, and operations teams can work from the same objective data.
-
Real-Time Visibility
Business intelligence in ecommerce provides real-time visibility by continuously syncing data from your storefront, ad platforms, payment gateways, and inventory systems. Instead of waiting for daily or weekly batch reports, teams can see orders, stock levels, and ad performance as they change and respond to problems and opportunities right away.
-
Smarter Marketing Spending
Ecommerce business intelligence connects your ad spend data to actual revenue results. It indicates which channels, campaigns, and creatives are actually profitable for customer acquisition and not just clicks.
-
Inventory Optimization
Demand forecasting with ecommerce business intelligence reduces stockouts and overstocking. These are two of the most costly scenarios in ecommerce operations.
-
Enhanced Customer Experience
Understanding customer buying behavior and analyzing customer patterns helps you target the right audience and retain them.
-
Faster Decision Making
When decisions are based on accuracy rather than guesswork, you can make them faster and with more confidence.
7 Key Benefits of Ecommerce Business Intelligence
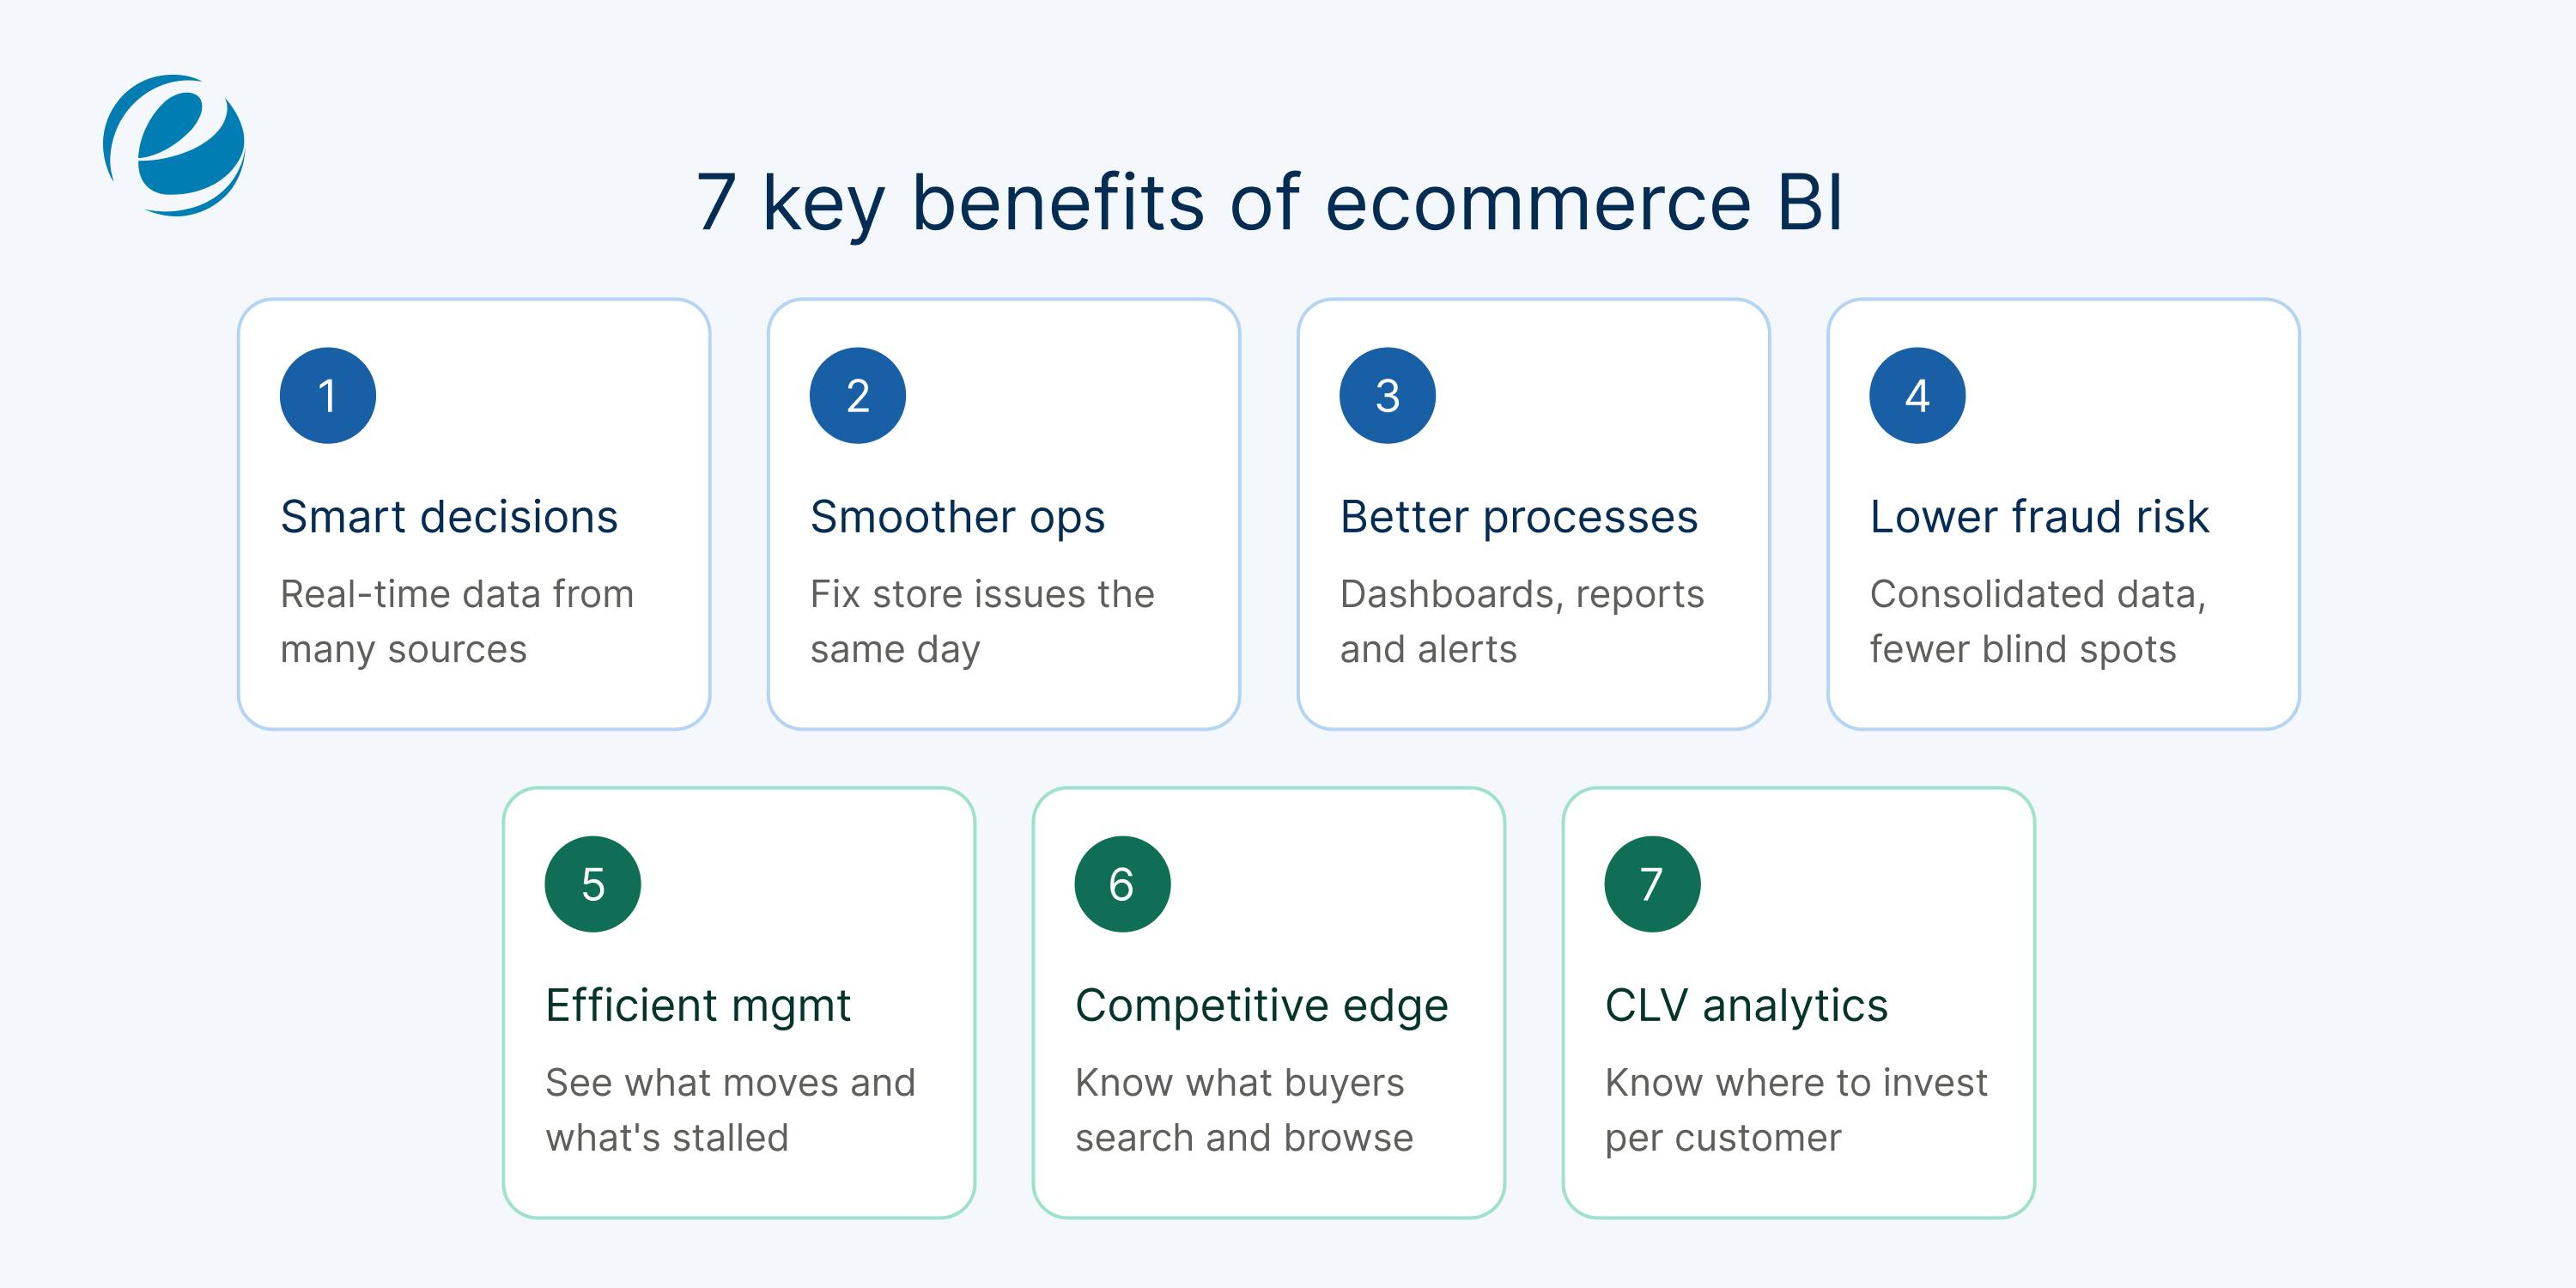
Implementing business intelligence for ecommerce offers several benefits that help organizations improve strategic planning, operational efficiency, and customer engagement. The 7 key benefits are as follows:
Smart Decision-Making
Ecommerce business intelligence provides accurate, real-time information to support informed decision-making. The data users see is accurate and comes from several sources. For example, social media monitoring results offer valuable insights into customer behavior and online shopping trends. Having these insights alongside proven ecommerce analytics tools supports better decision-making.
Streamlined Business Operations
By leveraging ecommerce business intelligence tools, you will boost the company’s productivity and efficiency. For example, if a problem occurs at any of your online stores or branches, you can address it immediately instead of waiting for the next day’s reports. Constant monitoring also accounts for seasonal highs and lows, helping businesses plan pricing and marketing strategies.
Improved Business Processes
BI tools for ecommerce support improved business processes. These tools include dashboards, operational reports, and alerts that help achieve better results. For example, operational reports help managers monitor daily tasks to ensure everything is done correctly every time.
Minimized Fraud Risk
Ecommerce business intelligence helps you spot fraud early by flagging unusual patterns, such as sudden spikes in refunds, chargebacks, and repeated order requests from a single IP address. It consolidates information in a centralized place instead of leaving it fragmented across your system databases. When fraud risk is lower and the organization meets all required compliance and security measures, it can run operations smoothly.
Efficient Management
Insights from ecommerce business intelligence help improve management and keep everything organized. Data helps you see what’s moving faster, what’s working, and what’s completely dead, all in real time.
Competitive Edge
Applying business intelligence in ecommerce gives entrepreneurs the competitive edge they need. For example, they can gather insights on their customers, potential buyers, what they search for, and their browsing patterns across company websites and social media channels.
Customer Lifetime Value Analytics
Business intelligence also supports ecommerce customer lifetime value analytics that calculate how much money each customer spends with your organization throughout their relationship with it. This information is highly relevant, as organizations can better understand their customers and decide where to invest more to offer an enriched experience.
Ecommerce Business Intelligence Use Cases
Organizations can apply business intelligence strategically across various aspects of ecommerce operations.
Executive Level and Strategic Intelligence
C-suite representatives and business leaders use BI tools to get a unified view of company performance and key metrics, track progress toward strategic goals, evaluate growth opportunities, and detect performance issues early. This enables informed, data-backed decisions that drive long-term business success.
- Combining KPIs across departments in performance dashboards facilitates a 360-degree view of business data.
- Predictive analytics for ecommerce uses real-time and historical data to inform corporate strategy.
- Competitor analysis compares pricing gaps, product trends, or low-value customer segments.
- Comparative performance analysis supports planning and budgeting.
Customer Analytics and Personalization
Ecommerce business intelligence offers valuable insights into customer behavior that are essential for retention.
- Analyzing customer browsing patterns, purchase frequency, and feedback
- High-value customer identification and analysis
- Dynamic customer segmentation based on customer demographics, purchase history, and behavior
- Identification of customer preferences
Sales Optimization and Revenue Growth
Business intelligence tools help ecommerce businesses identify sales performance gaps and analyze customer browsing and purchase patterns to increase sales and revenue.
- Sales performance tracking across regions, timeframes, and products
- Conversion funnel analysis to evaluate drop-off points
- Developing pricing strategies based on competition and demand analysis
- Upselling and cross-selling strategies according to customer purchase patterns
Essential Ecommerce KPIs to Track in Your BI Dashboard
There are several vital ecommerce KPIs to track in your ecommerce BI dashboard to help boost operational efficiency and stay ahead. Here are the top metrics that should be on your list.
Sales KPIs for Ecommerce
Sales KPIs offer a transparent and measurable way to assess business performance around conversions and revenue. Here are the names and formulas of the best sales ecommerce KPIs and metrics to help you assess the health of the sales pipeline and revenue:
Monthly Sales Growth
How to calculate:
- YoY Sales Growth (%)=(Current Month Sales – Same Month Sales Last Year Sales) / Same Month Last Year Sales ×100
Average Order Value
How to calculate:
- AOV = Total revenue/ numbers of orders placed
Annual Repurchase Rate:
How to calculate:
- Annual repurchase rate = Number of customers who’ve placed more than two orders in a year/ total number of customers* 100
Financial KPIs
Financial KPIs for ecommerce help you monitor actual sales, track metrics like the cash conversion cycle (CCC), and support the organization’s operational decisions. The key metrics to track are as follows:
Revenue growth
How to calculate:
- Revenue growth rate = (Current period revenue – previous period revenue)/ (previous period revenue)*100
Operating profit margin
How to calculate:
- Operating profit margin = operating profit / net sales * 100
Cash conversion cycle
How to calculate:
- Cash conversion cycle = Days inventory outstanding + Days sales outstanding – Days payable outstanding
Marketing KPIs
To ensure that your marketing campaigns deliver the desired results and your marketing strategies are aligned with your ecommerce business goals, track the following:
Conversion rate by campaigns
How to calculate:
- Conversion rate by campaigns = Number of conversions/number of clicks*100
Revenue per visitor
How to calculate:
- RPV = Total revenue of website/number of unique visitors
CLTV (Customer Lifetime Value)
How to calculate:
- CLTV = Average purchase value * purchase frequency * customer lifespan/churn rate
Read More: Customer Retention Guide
Bounce Rate
How to calculate:
- Bounce rate = Single-page sessions / Total sessions * 100
Website traffic
How to calculate:
- Website traffic = number of website visitors
Best Ecommerce Business Intelligence Tools in 2026
Refer to the table given below to learn about the best ecommerce intelligence analytics tools that ecommerce teams use in 2026.
| Tool | Major Focus Area | Suitable For | Strengths |
| Microsoft Power BI | Enterprise BI | Microsoft-oriented teams and growing brands |
|
| Tableau | Data Visualization | Data analysts and enterprise companies |
|
| Triple Whale | Ecommerce/ DTC Analytics | Shopify and BigCommerce online store brands |
|
| Glew.io | Also known as an all-in-one business intelligence platform | Omnichannel retail brands |
|
| Qlik Sense | Data exploration | Large-scale retail enterprises |
|
| Google Analytics 4 | Event-based, privacy-focused web analytics | Online stores |
|
| Mixpanel | Product behavioral analytics | Optimizing checkout and app funnels |
|
How to Choose the Right Ecommerce BI Software
Choosing the right business intelligence software is more than selecting a tool that displays intuitive graphs and dashboards. It’s about engaging your organization in strategic decision-making based on data-driven insights that can improve financial performance. Whether you are using BI software for the first time or upgrading your existing reporting tools, a guided approach helps ensure your investment delivers a strong return. Here are the key pointers to keep in mind when selecting the right business intelligence software.
State Your Business Objectives and Needs
Before stepping directly into features and functionality, understand what you are trying to achieve. Evaluate your key business goals and the decisions you are aiming for the business intelligence platform to support. Identify the purpose, whether it’s streamlining business operations, moving away from Excel, increasing sales, monitoring performance, or all of these. Identify the primary KPIs and metrics that hold significance and relevance to your stakeholders. The right software makes these metrics accessible and actionable.
Analyze Core Functionalities and Features
Clear, well-stated goals help you identify the capabilities that matter most to your organization. Here are four major capabilities to look for in a BI platform that existing customers rank highest.
Data Integration and Connectivity
When evaluating business intelligence software for ecommerce, make sure it has strong data integration and connectivity via APIs. The software should connect seamlessly with your existing systems, such as ERPs, CRMs, and cloud-based applications, and offer flexible connectors to bring together data from multiple sources. Integrations vary; some may take weeks, while others may take years.
Data Quality and Governance
Evaluate the data quality and data management processes. Since data preparation underpins all data discovery, you will need BI software that prioritizes it in its ecosystem. Inquire about the vendor’s data warehouses, data security, and its ability to handle large datasets. Data governance features are equally important; confirm whether the platform complies with regulations such as GDPR. Moreover, check that the platform offers cloud-based security features and role-based access.
Data Visualization and Reporting
Data visualization and reporting capabilities include interactive dashboards, customizable reports, and the ability to dive deep into data, ensuring self-service functionality for non-technical users to evaluate data independently.
Advanced-Level Data Analysis
If your organization needs more than descriptive analytics, make sure your ecommerce business intelligence software includes advanced features like predictive modeling, scenario planning, and machine learning integration.
How to Implement Ecommerce Business Intelligence: Step-by-Step
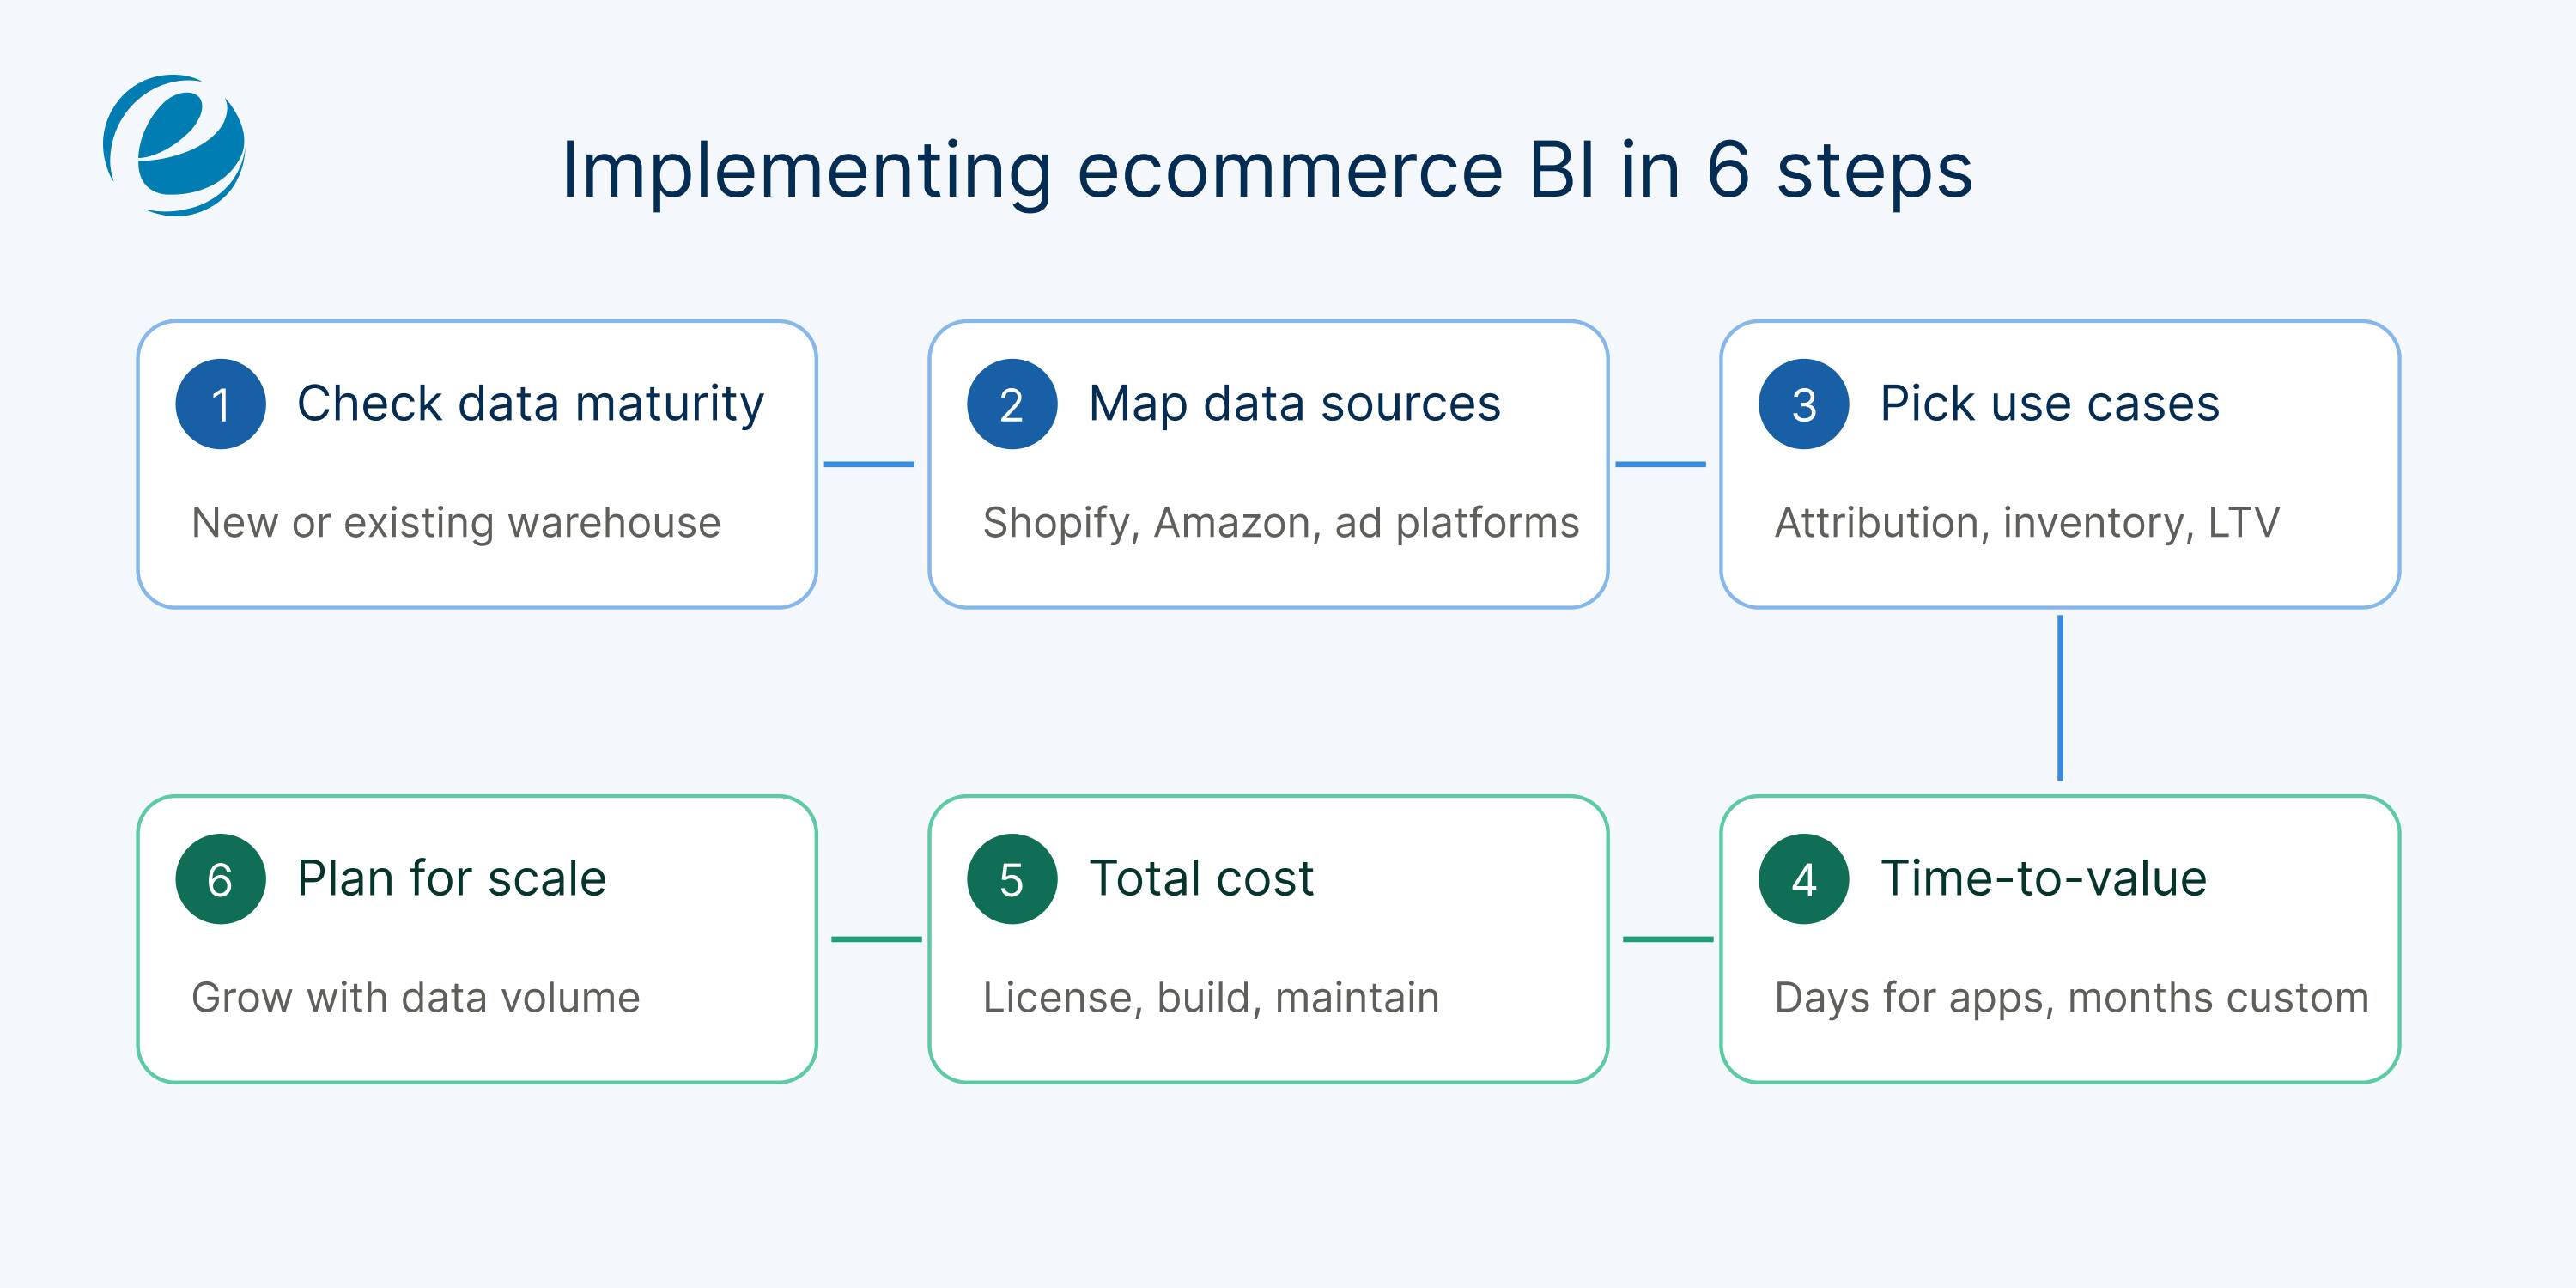
The below-mentioned step-by-step approach will help you implement ecommerce business intelligence solutions correctly.
Step 1: Evaluate Your Data Maturity
Assess whether you’re new to data warehouses or already have one. Plug-and-play ecommerce business intelligence tools can help organizations in the early stages of their data journey. Organizations with mature data practices may need a dedicated data infrastructure with business intelligence on top.
Step 2: Identify Your Key Data Sources
Name all the platforms your business utilizes in storefront and advertising, email, operations, and finance. Ensure that your BI tools offer native connectors to your most important sources, such as Shopify, Amazon, and other major ad platforms.
Step 3: Prioritize Your Most Critical Use Cases
Identify the business decisions that data can improve the most, such as marketing, attribution, inventory management, or customer LTV analysis. Begin with two or three questions that have the major impact on revenue, and set up your BI tools to answer those first.
Step 4: Connect and Clean Your Data
Connect your data sources to the BI platform, set up data pipelines, and clean the data by removing duplicates and standardizing formats like order status, currency, and dates. Finalize on one definition for each KPI, so every team has the same information.
Step 5: Building Dashboards and Reports
Create dashboards for your priority use case, beginning with a small set of KPIs. Set up scheduled alerts and reports so the right user receives the right information without manual work.
Step 6: Test, Train, and Improve
Check dashboard figures against your source systems before the rollout. Train your team on how to use the dashboard and review it regularly. You can introduce or add new data sources gradually as your team gains confidence.
How Much Does Ecommerce Business Intelligence Cost?
The estimated implementation cost of ecommerce business intelligence is based on project complexity. To elaborate further, it will be as follows:
| Implementation | Costs |
| Ready-Made Business Intelligence Tool (Subscription) | Free to a few thousand dollars per month |
| Basic Custom Implementation | $50,000 – $200,000 |
| Mid-Level Custom Implementation | $200,000 – $400,000 |
| Enterprise Custom Implementation | $400,000 – $1,000,000 |
Note: These costs are estimates and vary by vendor, data volume, and the number of integrations.
Common Ecommerce BI Challenges
Since every approach has pros and cons, knowing the benefits isn’t enough; you should always consider a process’s limitations. The common ecommerce business intelligence challenges that you may encounter are as follows:
Data Fragmentation
Customer, inventory, marketing, and order fulfillment data rarely live in a single system. Many ecommerce businesses use multiple platforms, and each has its own format and structure for storing information. As the number of sales channels and business applications increases, reporting becomes tough. The team wastes half its time matching numbers across systems instead of answering business questions.
Difficulties in Data Integration
Integrating data is one of the most crucial and challenging tasks for any organization. However, each application records business events differently, which often results in inconsistent reports. For example, one system records an order after payment, while another updates the status after shipment. These inconsistencies create reporting gaps and make it difficult to compare channel performance.
Technical Expertise
You will require technical expertise and software developer skills for building an ecommerce business intelligence platform from scratch. You will also need expertise in data engineering, data warehousing, and reporting. Many ecommerce businesses lack in-house teams and the ability to manage dashboards as systems and data sources change.
Even a minor update, like an API change, can lead to inaccurate information without notice. Using ecommerce services or working with a dedicated development team helps businesses maintain stable data pipelines and accurate reporting as they grow.
Manual Reporting
Manual reporting can become a daunting task as the business evolves and scales. Exporting data to Excel spreadsheets from different systems, monitoring totals, and merging reports consume valuable time every week. Reporting takes longer as information ages. Business decisions rely on numbers and facts; outdated data doesn’t reflect current performance.
Selecting the Right KPIs
Modern platforms offer several key metrics; you don’t need every one to make decisions. So, choosing the right KPIs for your business is just as important for making better decisions. Large dashboards often distract teams from the metrics that affect revenue and profitability. Businesses achieve better results when reports focus on a small set of KPIs that facilitate inventory planning, pricing, marketing performance, and contribution margin.
AI and the Future of Ecommerce Business Intelligence
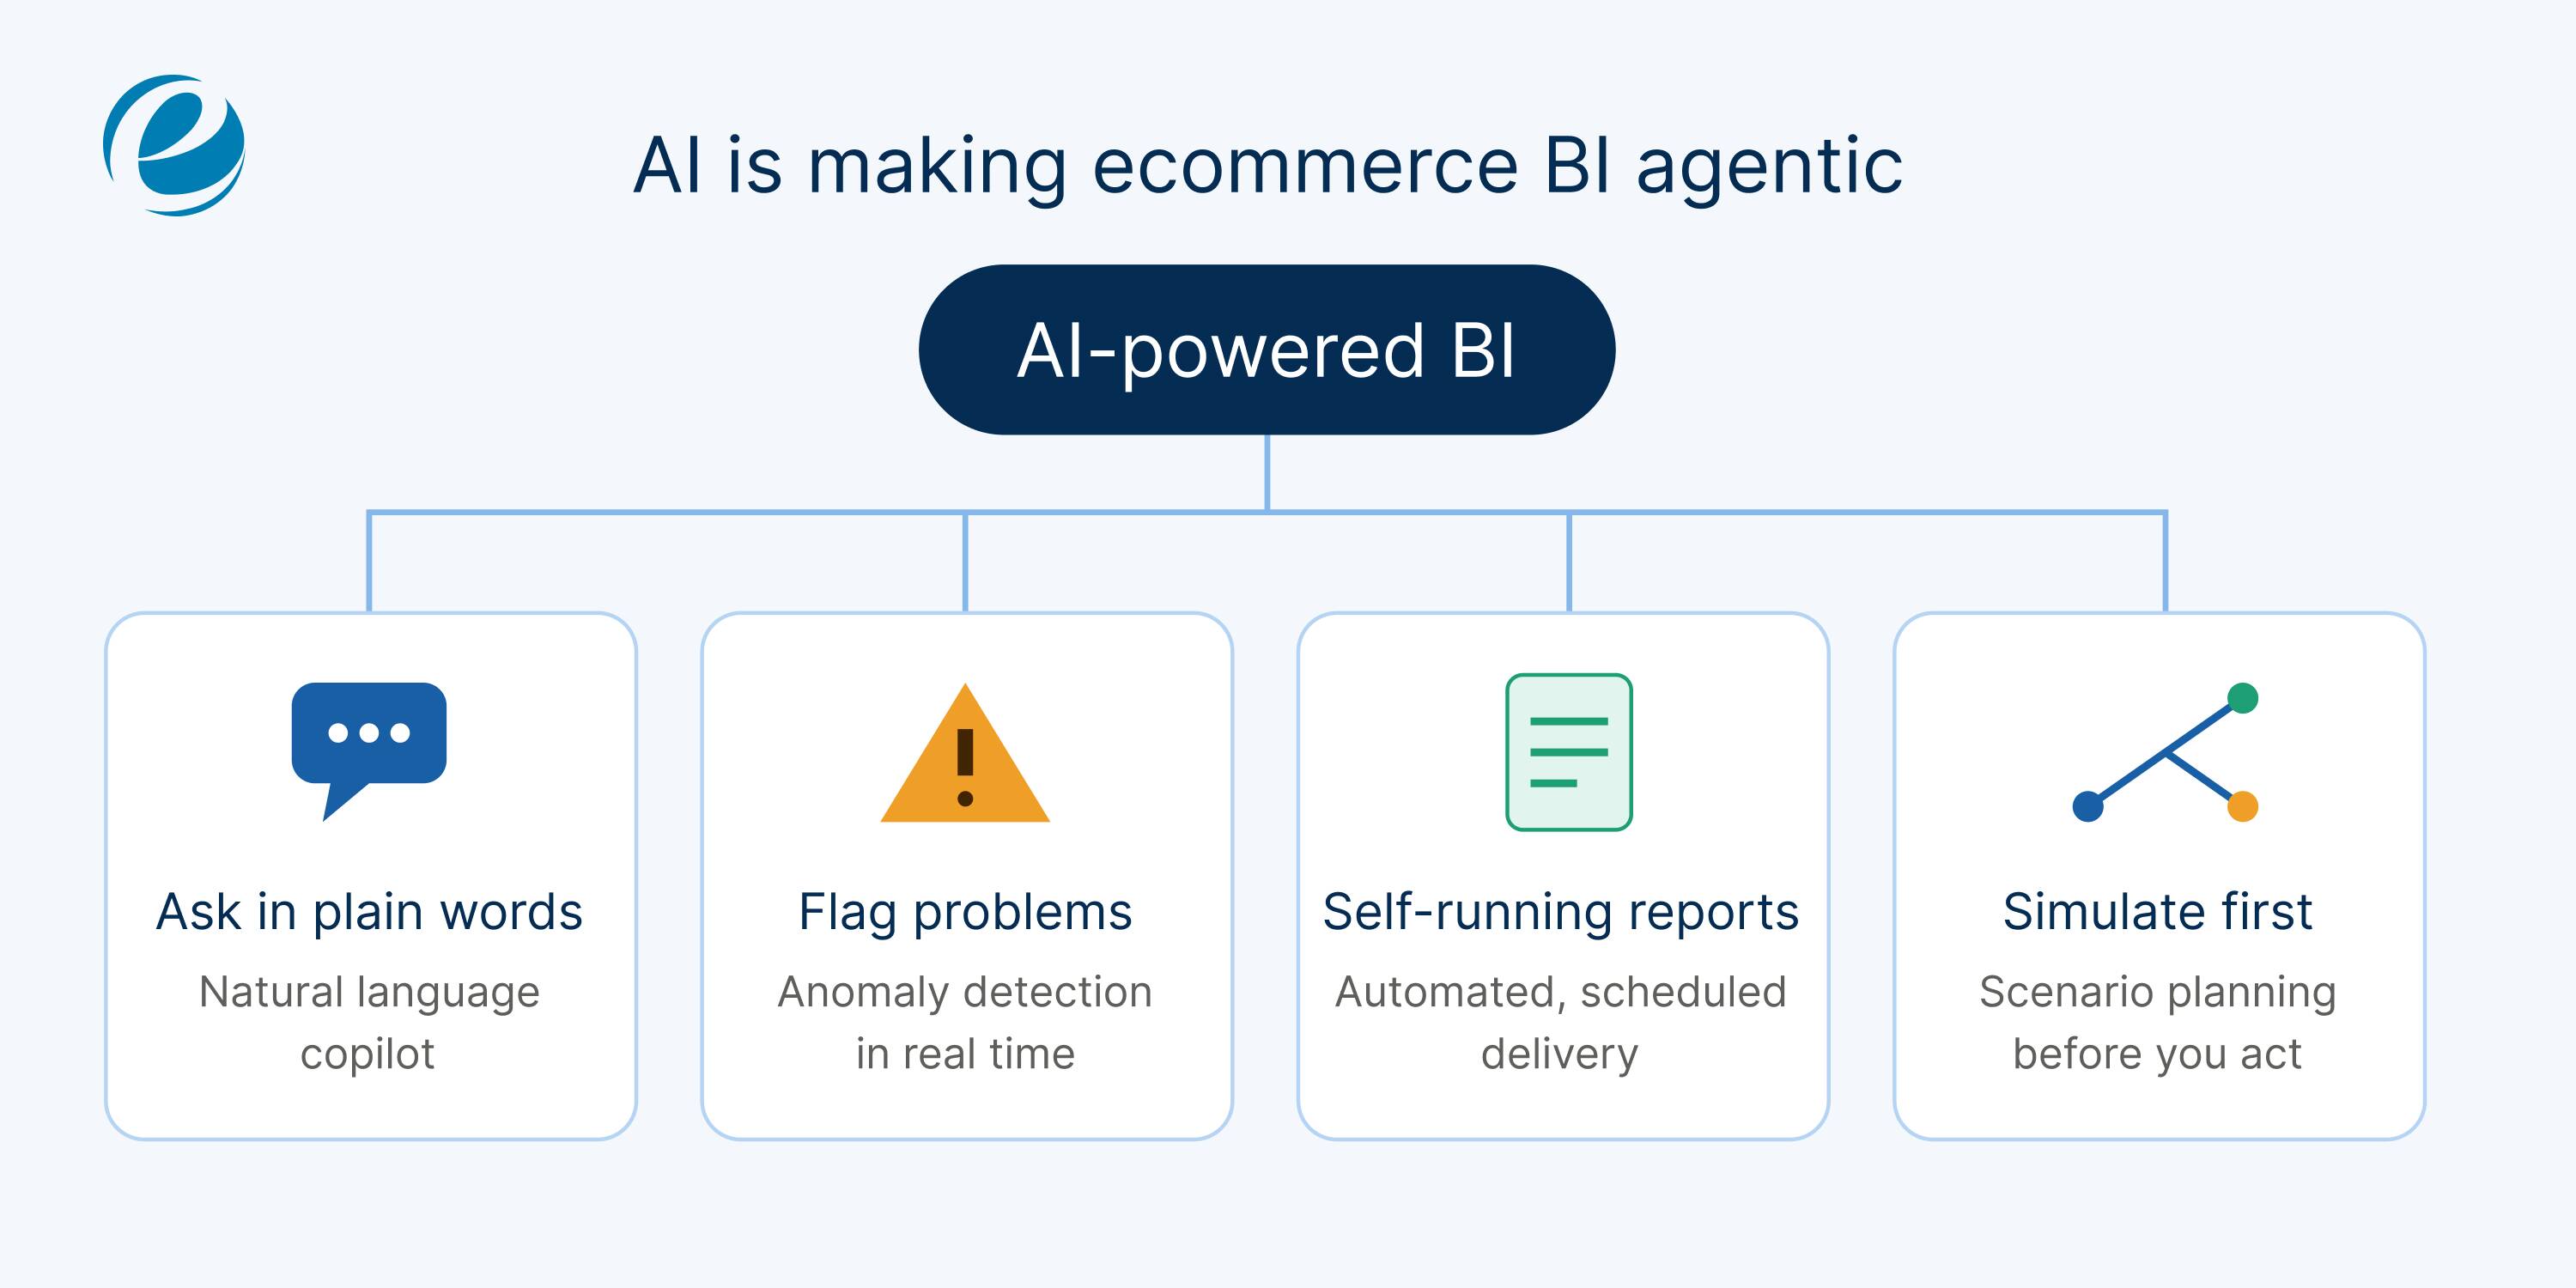
Modern ecommerce business intelligence platforms automate reporting, answer business queries, and help teams respond quickly to evolving business conditions. AI is moving ecommerce business intelligence into a more agentic era, where platforms no longer stop at displaying data.
Four capabilities stand out: natural language copilots (answering questions), flagging problems (anomaly detection), reporting that runs on its own (automated reporting), and scenario simulation that models outcomes before you act. Brands without in-house expertise can add these capabilities with AI development services.
- Asking a Question: Data gathering no longer requires building reports or writing database queries. Sales, finance, and marketing teams can ask questions in simple plain language and get answers supported by current business data. This reduces reporting time and gives non-technical users direct access to the information they require.
- Automated Anomaly Detection: Business performance varies throughout the day, so constant monitoring is more valuable than periodic report checks. It flags unusual changes in inventory levels, advertising costs, and product returns as they occur. This helps teams resolve issues before they become revenue losses or harm customer satisfaction.
- Automated Reporting: Generally, reports follow the same schedule every week or month. Modern ecommerce business intelligence platforms generate recurring reports automatically and deliver them to the designated team without manual intervention. It also lets analysts spend more time reviewing performance instead of compiling spreadsheets.
- Scenario Planning (simulation): Every business decision, whether related to pricing, marketing, or inventory, often carries financial risk. Scenario planning compares several business outcomes before implementing changes. This helps decision-makers assess the impact on revenue, inventory, or profitability. Reviewing multiple outcomes before deciding reduces uncertainty and supports better planning.
The future of ecommerce business intelligence includes unified commerce data, real-time decision support, predictive business planning, composable data architectures, and improved business accessibility.
How EmizenTech Helps You Build an Ecommerce BI Solution
At EmizenTech, building an ecommerce business intelligence solution means connecting your online storefront, such as Shopify, Adobe Commerce, WooCommerce, or BigCommerce, to centralized cloud data pipelines, developing custom reporting dashboards, and integrating AI-driven insights to monitor sales, inventory, and customer behavior.
Conclusion
Ecommerce business intelligence helps you switch from guesswork to data-backed decisions. Moreover, combining marketing, sales, and inventory data enables faster responses, fewer reporting errors, and higher revenue. If you’re developing or modernizing ecommerce business intelligence platforms, EmizenTech is here to help.
FAQs
What is business intelligence in ecommerce?
Business intelligence (BI) in ecommerce is the process of collecting data from your store, ad platforms, CRM, payment gateways, and logistics systems, then turning it into dashboards and reports. These show what is happening in your business and why. Teams use them to track sales, customer behavior, inventory, and marketing performance, so they can make data-driven decisions instead of relying on guesswork.
What is the difference between business intelligence and business analytics?
BI mainly looks at past and current performance and answers “what happened?” and “what is happening now?” through dashboards and reports. Business analytics goes further. It uses statistical models and predictive techniques to explain why something happened and forecast what will happen next. In practice, the two overlap, and most modern ecommerce BI tools include some analytics features.
Is business intelligence only for large ecommerce businesses?
No. Large retailers adopted BI first, but cloud-based tools have made it affordable for small and mid-sized stores too. Even a store with a few hundred orders a month can use BI to identify best-selling products, most profitable channels, and repeat customers. Smaller businesses can start with free or low-cost dashboards and scale up as their data grows.
What are the best BI tools for ecommerce?
The right choice depends on your size, budget, and tech stack. Popular general-purpose options include Microsoft Power BI, Tableau, Qlik, Zoho Analytics, Domo, and Metabase. Ecommerce-focused tools such as Glew, Triple Whale, and Polar Analytics offer ready-made connectors for platforms like Shopify, BigCommerce, and Magento. Before choosing, check integration support, ease of use, scalability, and pricing.
Which KPIs should an ecommerce BI dashboard include?
A strong dashboard covers the full customer journey:
-Sales: revenue, average order value, conversion rate, and gross margin.
-Customers: customer acquisition cost, customer lifetime value, and repeat purchase rate.
-Marketing: return on ad spend, traffic by channel, and cart abandonment rate.
Start with the KPIs tied to your current goals rather than tracking everything.
How long does it take to implement ecommerce BI?
It depends on scope. A basic setup with pre-built connectors and templates can be live in a few days to a few weeks. A custom implementation covers data warehousing, data cleaning, multiple sources, and tailored dashboards, and typically takes one to three months or more. Data quality and the number of systems you need to connect are the biggest factors in the timeline.
How much does an ecommerce BI solution cost?
Costs vary widely. Some tools have free tiers, and paid plans often start at around $10 to $30 per user per month. Ecommerce-specific platforms are usually priced by revenue or order volume and can run from a few hundred to several thousand dollars a month. Custom builds cost significantly more, ranging from $50,000 to $1,000,000 or more, because they include data engineering, integrations, and ongoing support. Always check current pricing with the vendor.
How is AI changing ecommerce business in 2026?
AI is changing ecommerce in several ways. It powers personalized product recommendations and search, dynamic pricing, demand forecasting, and automated customer support through chatbots and virtual assistants. It also generates product descriptions and marketing content, detects fraud, and optimizes inventory and supply chains. Within BI, AI adds automated insights, anomaly alerts, and natural-language queries, so teams can get answers faster without needing technical skills.
How do I choose the right BI software for my ecommerce store?
Start with your business goals and the KPIs you need to track, then check how well each tool fits them. Look for strong integration with your storefront, ERP, CRM, and ad platforms, along with good data quality and governance features such as GDPR compliance and role-based access. The tool should also offer easy-to-use dashboards for non-technical users and, if needed, predictive analytics. Finally, compare time-to-value, total cost of ownership, and scalability, so the platform keeps working as your data grows.
What are the common challenges of ecommerce business intelligence?
Common challenges include data fragmentation across platforms, difficulty integrating systems that record events differently, and the technical expertise needed to build and maintain a BI platform. Many teams also struggle with manual reporting that leaves them working with outdated data. Another frequent problem is tracking too many metrics instead of a focused set of KPIs. Using ready-made connectors, agreeing on a single definition for each KPI, and automating reports can help address most of these.


 +1 (989) 535-9295
 info@emizentech.com
 emizentech


